SISTEMI INFORMATIVI TERRITORIALI – GIS
Geographic Information System - GIS
- 29 Mag 2022
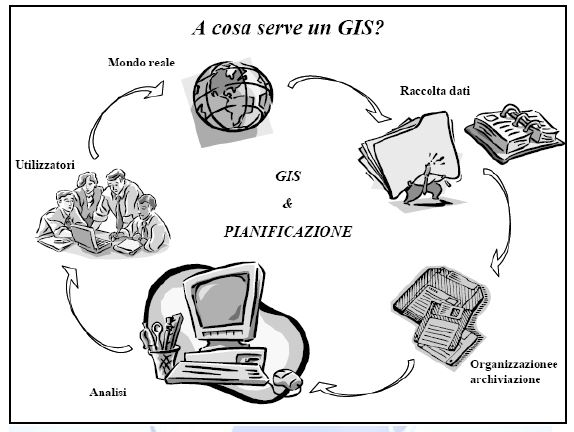
COSA E’ UN GIS?
Si trovano varie definizioni in letteratura:
“Un GIS e’ l’insieme di strumenti per acquisire, archiviare, estrarre, elaborare e rappresentare dati spaziali del mondo reale” (Burrough, 1986)
“Un GIS e’ l’insieme di procedure, basate sull’uso di sistemi informatici, usate per archiviare ed elaborare dati georeferenziati” (Aronoff, 1989)
Si può definire un GIS come un SISTEMA INFORMATIVO ovvero l’insieme di strumenti (HARDWARE e SOFTWARE), procedure e risorse che consentano la gestione delle informazioni (DATI).
Gli elementi fondamentali di un GIS sono: le procedure che permettono di realizzare operazioni di acquisizione dati, archiviazione, elaborazione, analisi e visualizzazione; i dati geografici georeferenziati, ovvero che sono riferiti ad un Datum geodetico cartografico; gli obiettivi ovvero lo scopo per cui vengono interrogati i dati per mezzo di specifiche procedure in modo da effettuare le migliori scelte possibili.
I DATI GIS
L’informazione territoriale può essere codificata in un sistema informativo geografico (G.I.S.), attraverso due tipologie principali di dato: dato vettoriali e dato raster.
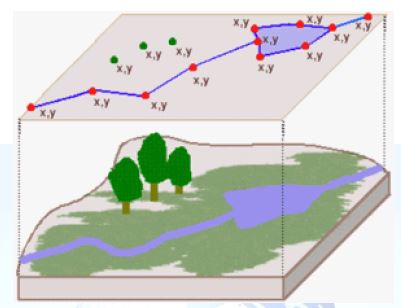
MODELLO DEL DATO VETTORIALE
I dati vettoriali forniscono una descrizione delle caratteristiche (morfologiche ed antropiche) del mondo reale all’interno di un ambiente GIS. Una features è qualcosa di visibile nel mondo reale: case, strade, alberi, fiumi, colline…Le features vettoriale hanno una forma descritta attraverso la loro geometria che è fatta da uno o più vertici interconnessi ognuno dei quali descritti dalla loro posizione (planimetrica) nello spazio (x,y). Opzionalmente si utilizza anche la z e si parla in tal caso di descrizione 2.5D.
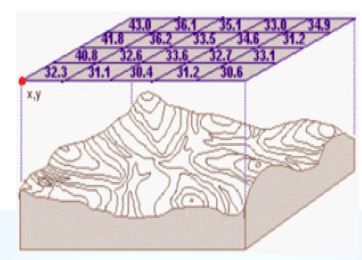
MODELLO DEL DATO RASTER:
Il dato raster rappresenta il mondo reale, attraverso un grigliato regolare in cui ogni cella rappresenta un area del terreno. La dimensione degli elementi del grigliato (pixel) definisce la risoluzione spaziale. A ciascun pixel sono associate le informazione relative a ciò che rappresenta sul territorio. La dimensione del pixel (pixel size), generalmente è espressa nell’unità di misura della carta (metri, chilometri, ecc.), è strettamente relazionata alla precisione del dato.
Quindi riassumendo, i dati raster sono fondamentalmente delle immagini, come delle foto aeree e/o da satellite; una griglia regolare formata da pixel di dimensione prefissata (per esempio 20×20 m, 30×30 m, 50×50 m, ecc.) in cui i valori di grigio sono registrati sequenzialmente nella memoria di massa di un elaboratore, per mezzo di una rappresentazione binaria; dall’ordine di registrazione, si risale alla posizione del pixel corrispondente. Le immagini raster da inserire nel G.I.S. hanno un file associato, che consente la georeferenziazione, come il C.T.R.
I modelli di dati raster sono utilizzati per descrivere fenomeni di rapida evoluzione, che variano con continuità (ad es. un modello digitale di elevazione D.E.M. e/o una carta d’acclività del versante.
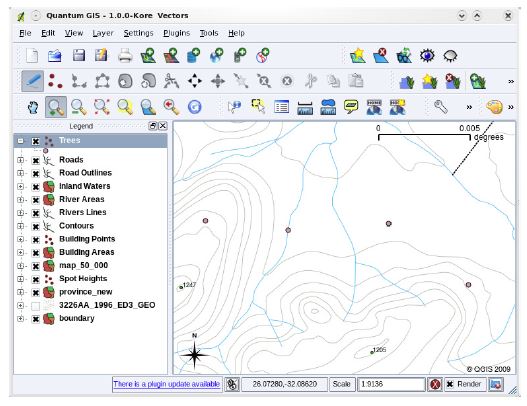
GESTIONE E VISUALIZZIONE DEI DATI IN UN GIS
Una applicazione GIS suddivide i dati in layers. Le features in un layer hanno le stesse caratteristiche (dati vettoriali dello stesso tipo o dati raster) e lo stesso tipo di attributi nel caso di dati vettoriali.
L’applicazione GIS permette di modificare la geometria dei dati nel layer (digitasing). Inoltre si possono aggiungere solo dati vettoriali dello stesso tipo. Quando vengono caricati dati vettoriali in un GIS essi vengono rappresentati con colori e simboli random. E’ importante personalizzare le mappe in modo da renderle più interessanti. Si possono scegliere i colori che sono più in accordo con le features (tonalità del blu con tutto ciò che ha a che fare con l’acqua) . Inoltre si possono scegliere simboli idonei, ad esempio un piccolo albero per rappresentare gli alberi.
Una applicazione GIS permette di scegliere la simbologia da utilizzare nel layer. Dal Layer proprieties si seleziona il tipo di simbolo: Single Symbol or Graduate Symbol. Quest’ultimo caso è adatto a features vettoriale rappresentate con un valore numerico variabile.
TOPOLOGIA
Il GIS si differenzia da un CAD per l’interazione (le procedure) che si possono avere con I dati. Domande come:
- qual è il posto migliore per mettere un’ospedale cosicchè sia raggiungibile da più persone possibili?
- quali case negli ultimi 100 anni erano sotto il livello di un fiume?
Il GIS permette di rispondere a queste domande. In particolare è la spatial analysis è il processo in grado di rispondere a queste domande. Ciò è possibile perché le features sono descritte non solo da geometria ed attributi, ma anche dalle loro relazioni topologiche che esprimono le relazioni spaziali fra features adiacenti o connesse.
 Ing. Andrea Petrarca
WHAT’S A GIS?
There are various definitions in literature:
“A GIS is the set of tools for acquiring, archiving, extracting, processing and representing spatial data of the real world” (Burrough, 1986).
“A GIS is the set of procedures, based on the use of computer systems, used to store and process geo-referenced data” (Aronoff, 1989)
A GIS can be defined as an INFORMATION SYSTEM or the set of tools (HARDWARE and SOFTWARE), procedures and resources that allow the management of information (DATA).
The fundamental elements of a GIS are: the procedures that allow to carry out operations of data acquisition, storage, processing, analysis and visualization; the geographical data georeferenced, or that are referred to a geodetic cartographic Datum; the objectives or the purpose for which the data are interrogated by means of specific procedures in order to make the best possible choices.GIS DATA
The spatial information can be encoded in a geographic information system (G.I.S.), through two main types of data: vectorial data and raster data.
MODEL OF THE VECTORIAL DATA:
Vector data provide a description of the characteristics (morphological and anthropogenic) of the real world within a GIS environment. A features is something visible in the real world: houses, roads, trees, rivers, hills… Vector features have a form described through their geometry which is made by one or more interconnected vertices each of which is described by their position (planimetric) in space (x,y). Optionally we use also the z and we speak in such case of description 2.5D.MODEL OF THE RASTER DATA:
The raster data represents the real world, through a regular grid in which each cell represents an area of the ground. The size of the grid elements (pixels) defines the spatial resolution. Each pixel is associated with information about what it represents on the territory. The pixel size, generally expressed in the unit of measure of the map (meters, kilometers, etc.), is closely related to the accuracy of the data.
So, in summary, the raster data are basically images, like aerial and/or satellite photos; a regular grid formed by pixels of prefixed size (for example 20×20 m, 30×30 m, 50×50 m, etc.) in which the grey values are recorded sequentially in the mass memory of a computer, by means of a binary representation; from the recording order, one goes back to the position of the corresponding pixel. The raster images to be inserted in the G.I.S. have an associated file, which allows georeferencing, such as the C.T.R.
Raster data models are used to describe rapidly evolving phenomena, which vary continuously (e.g. a digital D.E.M. elevation model and/or a slope acclivity map).DATA MANAGEMENT AND VISUALIZATION IN A GIS
A GIS application divides the data into layers. The features in a layer have the same characteristics (vector data of the same type or raster data) and the same type of attributes in the case of vector data.
The GIS application allows to modify the geometry of the data in the layer (digitasing). In addition, only vector data of the same type can be added. When vector data is loaded into a GIS, it is represented with colors and random symbols. It is important to customize the maps to make them more interesting. You can choose the colors that are most in tune with the features (shades of blue with everything that has to do with water). You can also choose suitable symbols, such as a small tree to represent trees.A GIS application allows you to choose the symbology to use in the layer. From the Layer proprieties you can select the type of symbol: Single Symbol or Graduate Symbol. This last case is suitable for vectorial features represented with a variable numerical value.
TOPOLOGY
The GIS differs from a CAD in the interaction (procedures) that you can have with the data. Questions like:
-what is the best place to put a hospital so that it is reachable by as many people as possible?
-which houses in the last 100 years were below the level of a river?
GIS allows you to answer these questions. In particular, spatial analysis is the process of answering these questions. This is possible because features are described not only by geometry and attributes, but also by their topological relationships that express the spatial relationships between adjacent or connected features.